Surveypura: Learn Quantitative Research with an Illustrated Twist
Making learning concepts and methods of quantitative research more fun and accessible for our students with the simulation pedagogical tool

We designed a simulation-based pedagogical tool called Surveypura to support classroom-based learning of quantitative research methods.
Why a simulation-based tool to learn quantitative research methods
Conceptualising a cross-sectional study, detailing the sampling plan, designing a survey questionnaire, collecting the data, analysing it, and presenting descriptive and analytical statistics are important skills for students planning to work in the development sector.
Students are expected to be able to chalk out a proposal for a cross-sectional study, conduct the survey and be able to calculate the basic measures such as the rates (e.g., incidence of tuberculosis), ratios (e.g., maternal mortality ratio), proportions (e.g., proportion of households with toilets), and measures of central tendency (e.g., average land holdings in a village).
The process of conducting surveys is both an art and a science. While it requires the art of navigating a village/community, establishing cordial relationship with the community members, and understanding the community’s needs and experiences well, it also requires a scientific temperament towards the collection and analysis of data.
For students pursuing higher education in social science, development or public health, these skills are often taught in a classroom setting with limited scope for field visits.
“We are usually sitting in the class, but while using Surveypura, we were standing, we were finding things, so we needed to be alert. The process was more involved than usual. In my previous course, I had learnt sampling in a theoretical manner. But this time using the tool, it was much more enrichingand gave me more confidence to know how to do it.”
About Surveypura
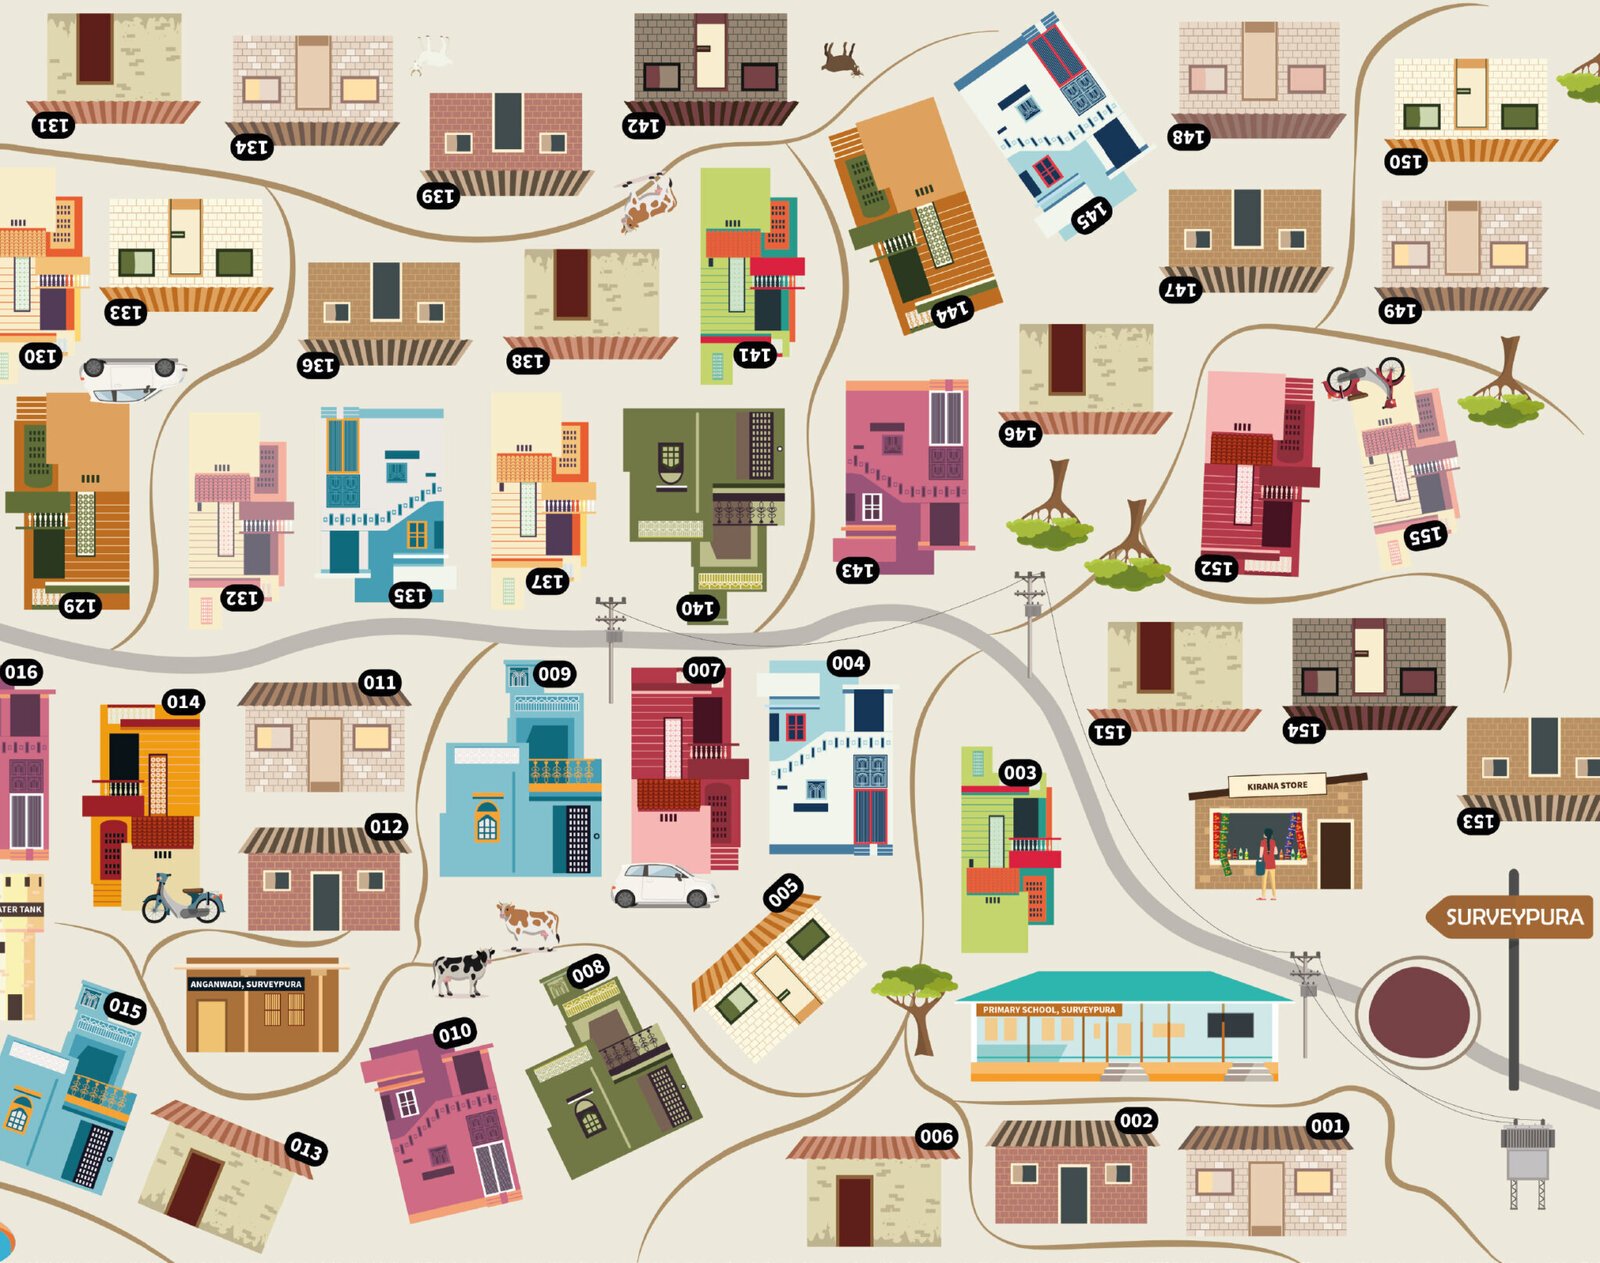
The tool includes a large illustration of a fictional village with 155 houses, alongside sociodemographic and health data on select parameters for each of the households.
The features of the houses, household characteristics, and the village have been carefully designed to give the visual feel of a village in the Indian context and to better assist the pedagogical process.
Visit Surveypura
The technical details and preliminary feedback related to the tool are published in BMC Advances in Simulation.
Surveypura being an in-class simulation tool, may provide a better opportunity for facilitators to closely observe and address the conceptual concerns of students. It can be used by facilitators working in the domains of social sciences (public health, development, economics, social work, education, demography, etc.) and mathematics.
Our faculty members are using this tool in courses related to research methods and epidemiology. The tool can be modified to suit other contexts.
“…it helps take away their fear for numbers which many times keeps them disengaged in class. This is especially important for students who come from disadvantaged backgrounds who may not always have enough resources to learn good mathematics.”
Adithya Pradyumna and Mukta Gundi, faculty at Azim Premji University talk about the simulation pedagogical tool for quantitative research methods called Surveypura.
The softcopy of the tool is licensed under Creative Commons.

©2024 Azim Premji University
- This publication may be replicated by any method without fee for teaching or non-profit purposes. The publication shall not be used for commercial purposes.
- Rights are reserved under Creative Common License: CC BY-NC-ND
- For copying in any other circumstances, or for reuse in other publications, or for translation or adaptation, prior written permission must be obtained from the publisher: Adithya Pradyumna: adithya.pradyumna@apu.edu.in and Mukta Gundi: mukta.gundi@apu.edu.in. Soft copies of the kit can be requested by writing to the publisher.
Keep watching this space for the user manual!
Postgraduate Programmes
MA in Development
Build a meaningful career improving the lives of the vulnerable