Why teachers need to be more sensitive about steering students towards a preferred path in Mathematics
Jayasree, in At Right Angles (AtRiA) magazine, shares an instance where she tried to get a quantification for the idea of steepness from a group of students. She explains the need to articulate to them the reason for nudging them to a specific path.
Sometimes as teachers we tend to expect students to use a particular definition, notation, or representation, though what students come up with on their own may be a legitimate way of working as well.
Some of the reasons why we do this could be that
a) having seen ahead of the students in the subject, we anticipate that the definition or representation suggested by the student will lead to problems on the path ahead or
b) we see specific advantages for our particular definition/representation, that the student suggested one may not have or
c) simply because we are used to one particular representation, and the student suggested one happens to be different from what we are used to.
In the following article I reflect on one such instance where I steered towards a ‘preferred representation’ and my reasons for doing so. I wonder whether the ‘push’ was justified.
In a nutshell
The instance I focus on in this article is a conversation with a 7th grader that happened through a chat medium, as part of an enrichment course on school science and mathematics.
There were around 15 students and 2 – 3 course coordinators who were part of the discussion forum.
In this exchange, my goal was to get the group to come up with a ‘quantification’ for the idea of steepness, so that the steepness of two straight lines could be compared, even when a ‘visual comparison’ is not possible, and they are not drawn alongside each other.
The exchanges were spread across a time span of three weeks giving time for all involved to think about and respond to posts and served as a build up to a forthcoming class on graphs.
In this article, I focus on the interactions with one student – Siddharth. Siddharth had not been introduced to the formal notion of slope at school.
The conversation started with my inviting students to post whatever they could say about the journey represented in the graph in Figure 1.
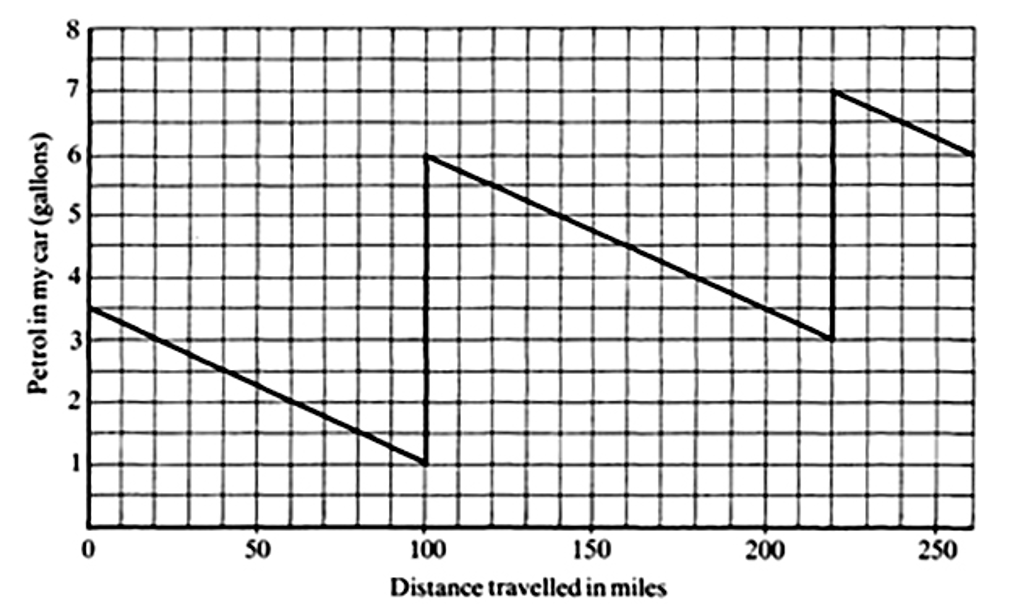
Figure 1. Image courtesy: Shell Centre Resource.
The Language of Functions and Graphs (1985), p71 (193).
One of the course coordinators set the ball rolling with the comment that the second 2.5 gallons consumed took him farther than the first 2.5 gallons. I decided to use the coordinator’s oversight to open up a conversation and asked the group if the coordinator was missing something out.
Siddharth promptly responded that in the ‘second lap’, 3 gallons of petrol were consumed (and not 2.5) and that explained the extra 20 miles. He also identified that the car travels 40 miles per gallon of petrol and that the sudden spikes in the graph could be explained by the refueling stops.
Now I asked them, if it were true that the car travelled a longer distance on the second 2.5 gallons (as the coordinator had said), how would the graph look? In what way would it be different from the one given?
Siddharth responded that in this case, the graph would be “less steeper” than that before the first refueling. He went on to add that if a gallon had given 80 miles instead of 40, the line would have been “half less steeper”.
Now ‘half’ implies quantification of some kind and I wanted to elicit that. Siddharth’s first explanation was that in the current graph, for every gallon of petrol the graph line goes down and right by four blocks.
A line half as steep as this one would go ‘two blocks right’ instead of four. Now a line that goes right by two blocks for every block down would be twice as steep as one that goes right by four blocks and not half as steep as Siddharth said (see Figure 2).
This could have been a slip of the pen (or the keyboard in this instance!) or it could be a struggle to quantify this intuitive notion of steepness, such that the relation ‘half as steep’ holds between the two lines.
I asked the group to take some time to think over that response and soon enough, Siddharth came with the contrary answer that if a gallon had given 80 miles instead of 40, the fuel efficiency would have been double that now and in that case the line would be half as steep.
Perhaps the fuel efficiency being double and that this line would go right by eight blocks instead of the current four as in Figure 2, connected well and made sense to him. “As the fuel efficiency decreases, the graph line becomes more steeper”, he said.
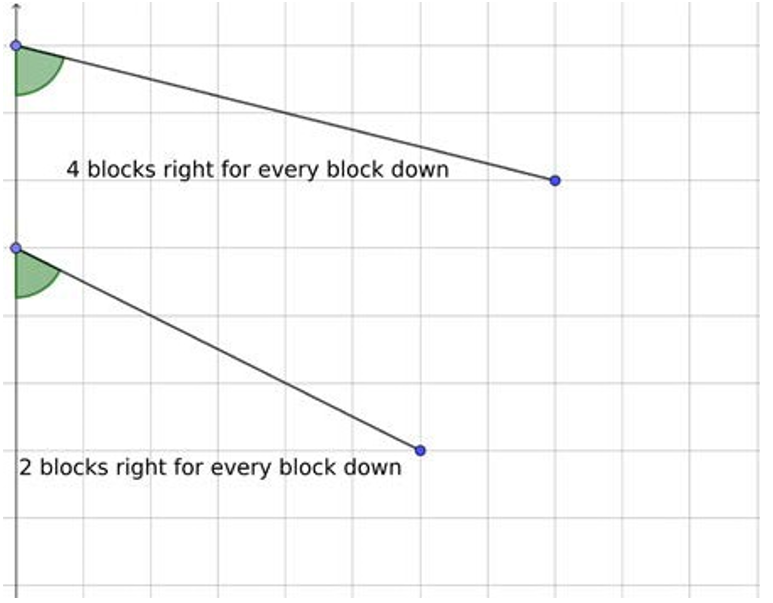
Figure 2: Angle made with y‑axis as measure of steepness
Calling attention to the “physical meaning” of steepness here, I asked for an explicit quantification of this concept of steepness. Siddharth came up with five ways to do this through the conversation.
I kept pushing him on to something else with the first four ways, till he finally came to the conventional ‘“rise”÷“run”’.
The heart of the matter
I now describe his first four ways and the objections I raised to them.
- His first idea was to look at the angle that the line makes with the y- axis. I granted that this is a possible way, but we usually look at the angle that the line makes with the x‑axis.
I also asked if there was some other way, especially one that can be read off from the graph, and not require a measurement, like the angle. Now Siddharth came up with two more ideas. - The second idea was to look at the part above the graph in the first block to the right of the y‑axis (which he abbreviated to ‘patl’ in the conversation, which I will also follow here!), as he has highlighted in Figure 3.
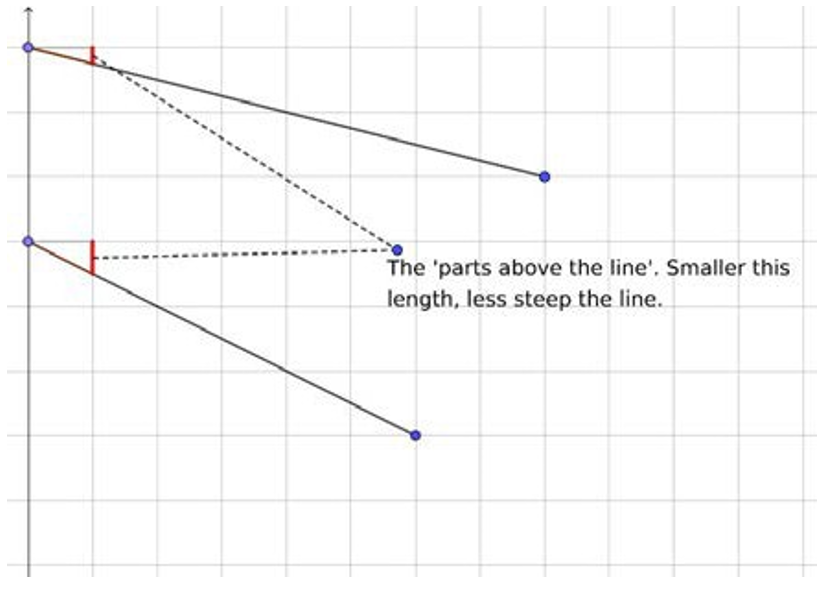
Figure 3: ‘part above the line — (patl)’ as measure of steepness
He was looking at how much the line ‘dropped’ in the first block immediately to the right of the y‑axis. The smaller this drop is, the less steep the line, he said.
The third idea was “See how many miles does the line cover for 1 unit on the y‑axis.”
For reasons unknown to me then (and now!) my response to his third way was to tell him to look for a way that would quantify the steepness of any line and not just the petrol-distance graph here!
His method 2 is the reciprocal ratio of that described in method 3. I spelt it out for the benefit of the rest of the class as “how much does the line fall when it moves right by one unit”. Now this is essentially the same as the conventional ‘“rise”÷“run” ’, but stated differently.
I wanted him to clarify it more. Noticing that he had arrived at the measure ‘patl’ by considering only cases where the line cuts the y‑axis at an integer value and there is a clearly visible drop in the first block to the right of the y‑axis, I gave him examples of lines which do not cut the y‑axis at an integer value.
In such cases, the relevant drop spans more than a unit length (line AB in figure 4) or needs to be adjusted otherwise to get the slope (line CD in figure 4).
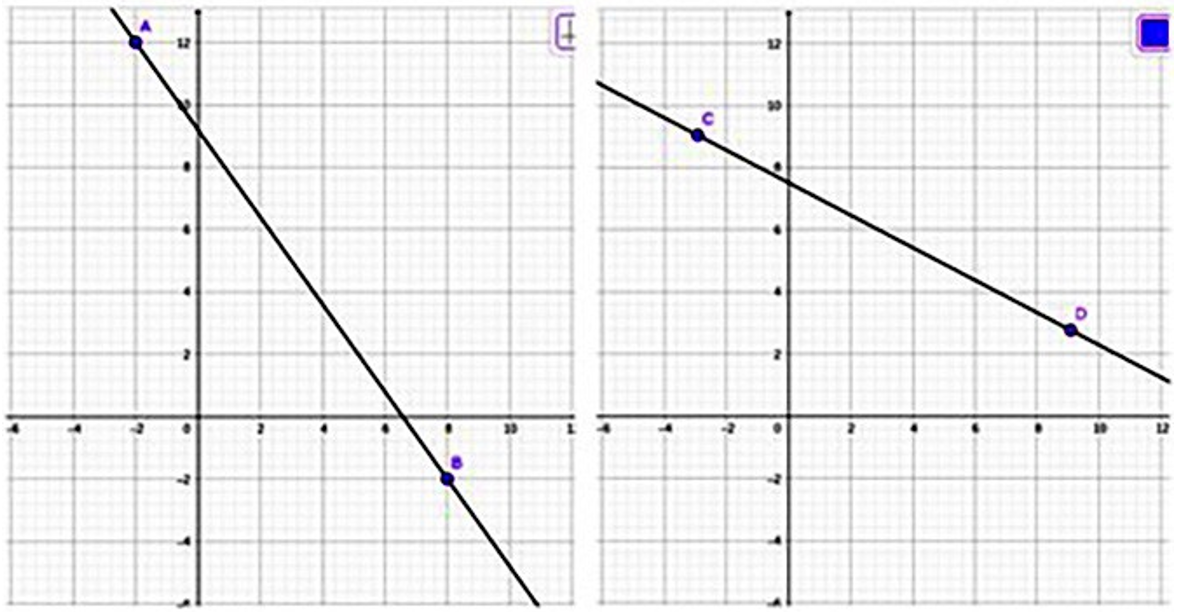
Figure 4: What is the ‘patl’ here? Does it measure steepness?
I asked him how he would modify his measure for these cases. Also, as in the case of the angle with the y‑axis, ‘patl’ would need actual measurement with a ruler, and I suggested that he look for something that can be read off from the graph.
He came up with a fourth way, saying that he would come back later with a response to my comment.
- “One way to figure out the steepness in a numerical way is to use the formula
length of the graph line
number of boxes it covers
From this formula you get the amount of the graph line in a box. ”
He explained this with an example.
In the figure that he drew (Figure 5), he measured the length of the red line to be 8.5 units and its horizontal span is 10 boxes, and so he said the steepness was 8.5÷10 which is 0.85.
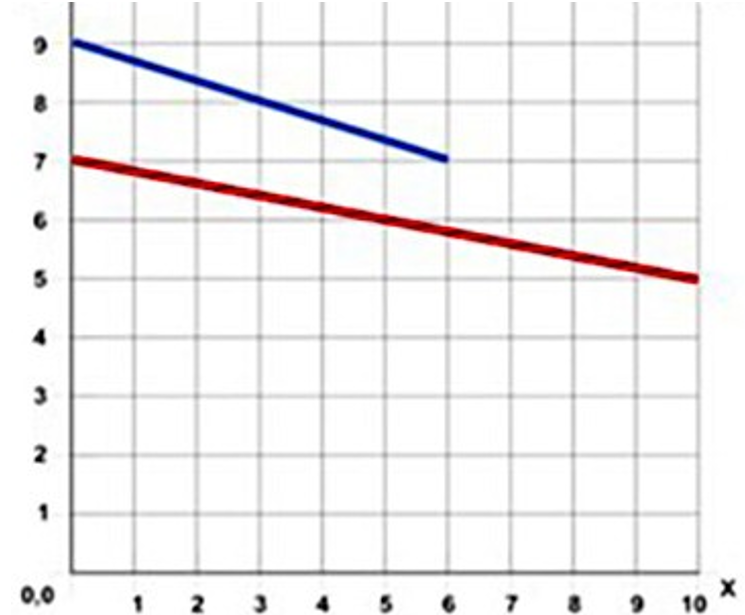
Figure 5: Secant as measure of steepness
Image courtesy: Siddharth
Here he measured the length of the line with a ruler, whereas he counted the number of blocks on the graph sheet and took the ratio of these two quantities in two different units.
I let the difference in units pass but chose to focus on the fact that this measure would not remain invariant if I extended, say, the blue line to the edge of the sheet.
Extending the line straight on is a move which does not change what we intuitively understand as steepness and we wouldn’t want its ‘measure’ to change as well after this move.
He said we could still preserve the measure, by allowing only specific extensions — extending by integer unit multiples of the initial line segment considered. “If you increase the line length and the number of boxes it covers with the same number (that is by the same multiple), you will get a line with equivalent steepness.” He called this ‘equivalent graph line’ (EGL) drawing on the notion of equivalent fractions.
The steepness of the extended line, if it is an EGL, would be a fraction equivalent to the original ratio and therefore invariant.
At this point, driven by my concern of not dampening his spirit by my finding fault with four of his suggestions, I suggested that he think of comparing the steepness of staircases by placing ramps on them.
Whether triggered by this, or on his own he came to the conclusion that “The easiest way to figure out the steepness of the line is to see how many boxes does the graph- line covers in the x axis for every box in the y axis.” and that “Steepness is a measure of how quickly/ slowly something is happening.”
This was as close to my preferred definition of ‘“rise”÷“run” ’ as it could get and here the conversation was wrapped up in that state of elation that every teacher would have felt when a student comes up with such an insight.
In a quick glance at the conversation, we see Siddharth trying different ways to quantify steepness drawing on his intuitive understanding of the concept. As the teacher, I validated some of them, and pushed him on to find what in my view was a ‘better’ measure, which also happened to be the ‘textbook-given’ measure.
There were reasons given to look for an alternative measure at each step – be it cases not covered by the definition, or the invariance of the measure under conditions where we would want it preserved, or readability from the graph.
In the process, Siddharth was functioning as a little mathematician, creating and naming concepts (patl, EGL) and noticing other related things as well. For example, there are lines which divide every square on a graph sheet diagonally into two halves and he termed these the ‘Perfect Graph lines’.
He also noticed that such lines make an angle of 45° with the y‑axis. He then saw that lines steeper than this would lie above this and others below. Lines of slope 1 and ‑1 acquired a certain ‘glow’ for me after this conversation! It was an enjoyable exchange for both of us.
Looking back
Two months past the conversation, having stepped down from cloud nine, and having taken a closer look at the conversation, I have other thoughts. Looking at the five different measures for steepness that I got, all of them were reasonable measures, of course in need of due modifications, but retaining the spirit of the definition.
I accepted three of them (perhaps half-heartedly?), and rejected one before Siddharth came up with a measure acceptable to me. I had some implicit criteria for a ‘good enough’ measure like invariance under extension, generality (applicability to all cases) and ‘visual calculability’ from the graph. I now look back on these criteria and wonder what should have been the criteria for a suitable measure.
For a 7th grader, the ‘angle that a line makes with the y‑axis’ gives a much better intuitive sense of steepness or slope as we call it, than when it is defined as “the tangent of the angle that it makes with the positive direction of the x‑axis”.
If the purpose were just to compare the steepness of two lines, the former may even be the better measure, whether or not it is possible to get the exact measure visually.
Looking back, I now think the question “Would I want to consider a line that makes 60° with the y‑axis to be twice/half as steep as one that makes 30°?” is a more pertinent question than “is it readable from the graph without actual measurement?”, in deciding whether “the angle made with the y‑axis” as a measure of slope is suitable enough.
The ‘patl in the first block’ needs to be redefined perhaps to cover all possible orientations of the line and modified as needed for lines with positive slope but boils down to the familiar ‘“rise”÷“run” ’, though not articulated in so many words.
My objection here was again ‘not readable from the graph and needs measurement’ which I will come to in a while. The third method, which got scant attention is essentially ‘run divided by rise’ stated in the context of distance covered (run) and petrol consumed (rise).
The fourth method, if the mismatch in units is resolved, would be the secant of the angle that the line makes with the x‑axis, which is a reasonable quantification too. But because Siddharth expressed the measure in terms of lengths of line segments, the issue of invariance when the same definition is extended for a line comes up and needs to be addressed.
Now why should ‘“rise”÷“run”’ be the preferred measure over the other four options put forward by this child? Just because the textbook says so? Should “readability from the graph” be the deciding factor? Though desirable, does ‘“rise”÷“run”’ meet this criterion?
With the kind of problems we encounter in school textbooks, we somehow tend to think so! We are so used to having those integer points, from which we draw those perpendicular lines and come up with the ‘“rise”÷“run”’. But does it always work?
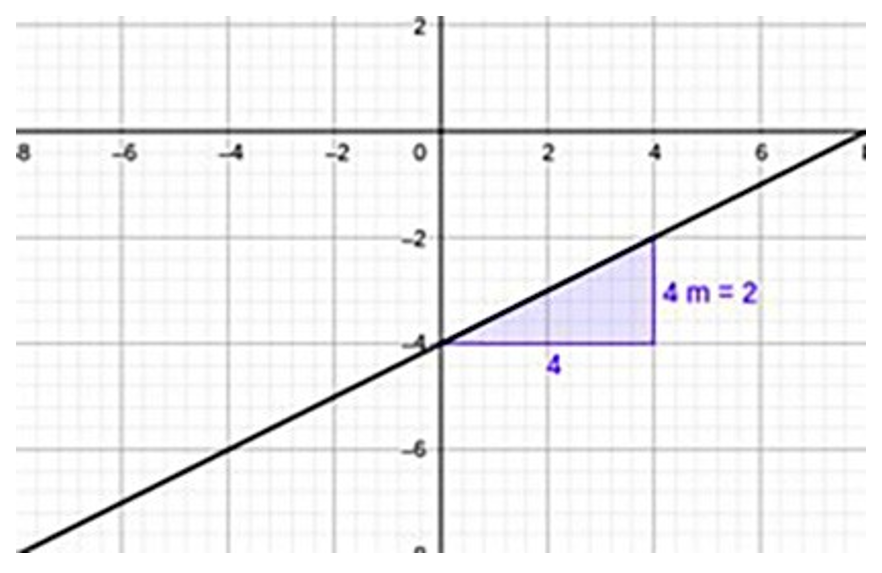
Figure 6: Slope as rise/run
Consider a line with irrational slope. It could have at most one integer point. (Note that if it had two integer points, its slope would be the ratio of two integers and hence rational.)
In such a case, clearly the ‘rise’ and ‘run’ that we need cannot both be read off from the graph. Even if we consider a line with rational slope, it is very much possible that it will not pass through any integer points at all.
For example, consider the equation y = x + 1. Clearly, it has infinitely many integer points. But if the intercept is changed to 1⁄3, instead of 1, the line y = x + 1⁄3 dodges all integer points. (Figure 7)
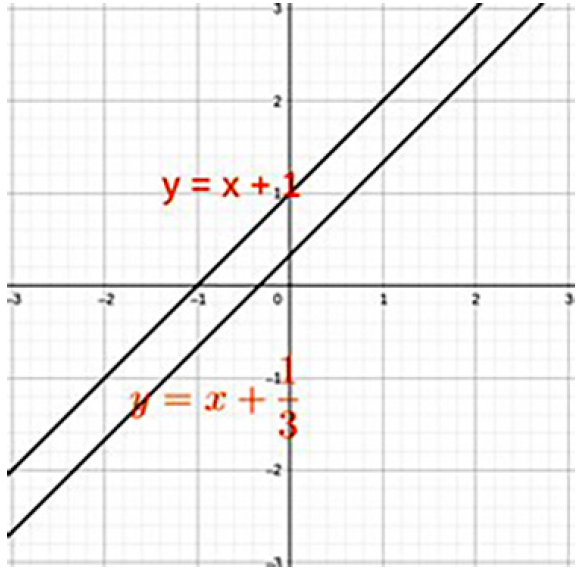
Figure 7: Line with rational slope and no integer points
Or consider the equation 3x + 6y = 19. If this line had integer points, at those points the left-hand side of the equation would a multiple of 3, but the right-hand side, 19, is not. So, this line cannot have integer points as well.
Thus ‘“rise”÷“run”’ is not always ‘readable’ from the graph. So why then should it be the preferred measure for steepness? ‘“Rise”÷“run”’ has an advantage that the other four measures do not have.
As Siddharth rightly pointed out, steepness is a measure of how quickly/slowly something is happening, so the numerical measure that we define for steepness, should capture our intuitions about the varying ‘rates’ at which this happens.
A straight line represents how two quantities vary with each other, and the steepness of the line captures how fast or slow one quantity varies with another. For example, if the variable on the y‑axis grows much faster than the one on the x‑axis, the graph would be a steep line. ‘“rise”÷“run” ’ tells us how fast the variable on the y‑axis is growing compared to that on the x‑axis.
This meaning does not come through so clearly when slope is quantified as length of ‘patl in the first block’ or the
length of the line discussed above.
horizontal span
Thus, the preference for ‘“rise”÷“run” ’ is because it reflects the physical meaning underlying slope better when compared to the other two.
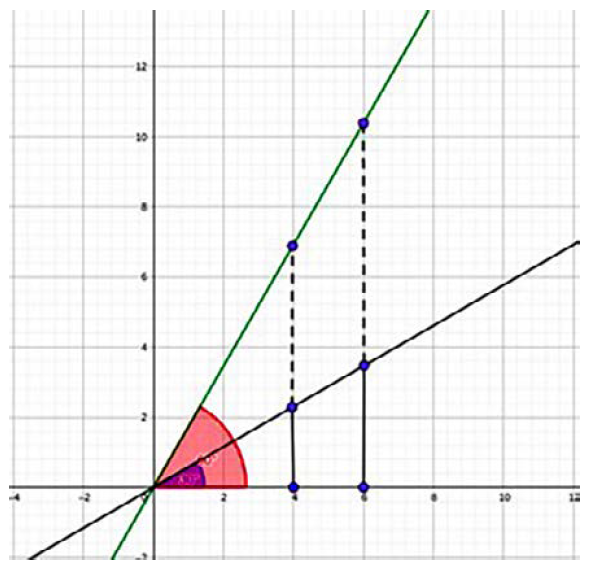
Figure 8: Is one line twice as steep as the other?
Similarly, the y‑axis variable of a straight-line graph making 60° with the x‑axis is not growing twice as fast as the y‑axis variable of a line making 30° with the x‑axis.
In the context of rate change, the tangent of the angle that the line makes with the x‑axis captures our intuition better than the measure of the angle itself.
So then the criteria should have been the ease with which the definition lends itself to meaning making in context, and not ‘readability from the graph’. Perhaps the missing pieces ‘flash upon that inward eye’ only in ‘vacant or pensive mood’ and not amidst the chatter of the classroom!
But there is always a next time…when I will be more accepting of student suggested and perhaps ‘unconventional’ measures. But at the same time, I realise that I may have to ‘push’ towards the measure accepted by the community.
When I do ‘push’ the student along a preferred path, I will be more sensitive to the reason why I am doing so and clearly articulate it to the students as well.
Thanks to Siddharth Kothari for the enjoyable conversation and to Genwise Talentdev for the opportunity to interact with this group of students.
About the author:
A passionate mathematics teacher, Jayasree has taught math across levels, right from middle school to undergraduate.
She loves to share her fascination for math with learners and initiate in them the joy of finding things out for themselves. She has also worked on creating diagnostic assessments, adaptive learning modules and teacher support materials for these.
With a Masters in Mathematics from IIT Madras, she is currently enrolled for a PhD in math education from the Homi Bhabha Centre for Science Education (HBCSE), Mumbai.
Jayasree may be contacted on jsree.t.s@gmail.com