Maths Education: How spinners can help students integrate probability within the rest of data handling
The Math Space (Mathematics laboratory at Azim Premji University) team, in At Right Angles (AtRiA), explores the variety of ‘spinners’ and the teaching opportunities available, if educators are willing to take a chance on them.
Data Handling, Statistics and Probability have gained prominence in school Mathematics over the last 5 – 6 years and thanks to the pandemic we all understand how crucial it is to have a basic understanding of probability.
This topic is included in Classes VII and VIII according to the NCERT syllabus and is part of the respective data handling chapters.
However, the probability portions of these two chapters seem very disjoint from the rest of the data handling parts. The integration happens later in Class IX when chapter-wise statistics and probability are separated. However, one does not need to wait that long. Spinners provide an excellent way to integrate probability within the rest of data handling along with many other benefits.
Spinners are inspired by the spinning wheels used in gambling. They can be easily made using a corrugated cardboard or a cardboard box as a base of the manipulative. Ideally this base should be at least 8 – 10 cm along each dimension.
A spinner is usually circular, but other shapes can provide very interesting interlinkages among different topics – we will discuss this later.
Figure 1 shows a circular spinner mounted on the rectangular base of the manipulative. The circle can be split into any number of sectors. Consecutive sectors should be coloured (or shaded) so that they can be easily distinguished from each other. It is better to draw the spinner on paper, cut out the circle and paste it on the cardboard base.
A safety-pin can be used as the needle and push pin can be used to attach it to the base. The push pin should pass through the ‘eye’ of the safety-pin and the centre of the base (Figure 1).
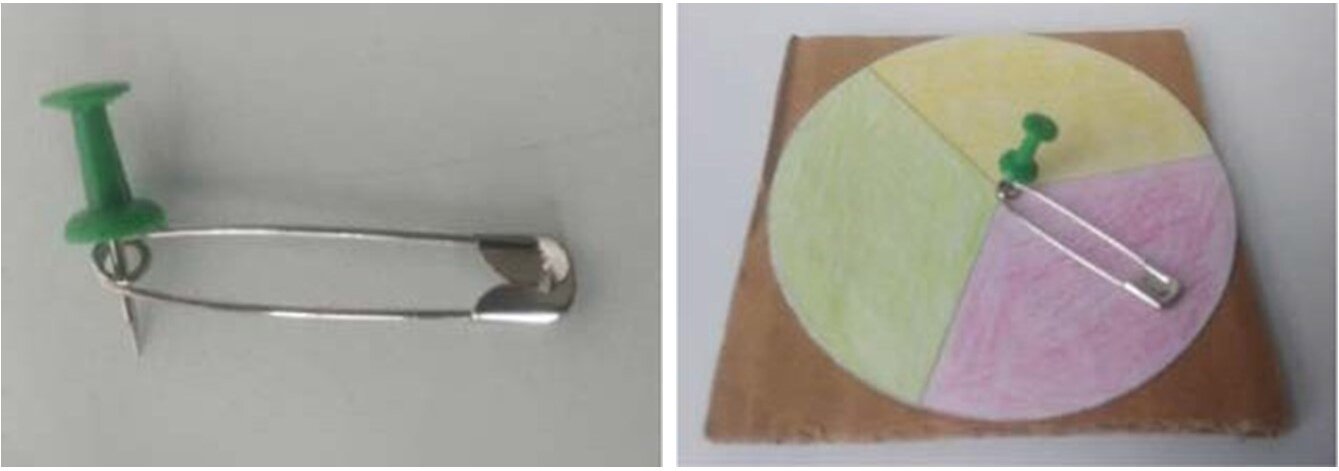
Figure 1
Observe that there is no restriction on how many sectors the circle can be split into. Therefore, a circular spinner provides much more freedom than the standard manipulatives for probability, viz. (fair) coin – 2 options, (fair) dice – 6 options, playing cards – 52 (or 13 or 4) options.

Figure 2
Moreover, the rest, i.e., coin, dice and cards are good for equally likely outcomes only. And this often creates a misconception that if there are only two possibilities then the chances must be 50 – 50 or the probability of each must be ½.
This can again be easily rectified by suitably designed spinners. Would the probabilities of blue and red be equal for spinners A, B and C in Figure 2?
Such spinners can help students relate probability with the areas of the respective sectors.
Not only that but also observe that circular spinners look just like a pie chart. Therefore, any pie chart can be converted into a spinner! Thus, it is possible to collect data in a class or from a group of students, create a pie chart, and convert that into a spinner.
Now the relative frequencies of the distribution (which is represented by the pie chart) become the (theoretical) probabilities, thus connecting statistics (or the rest of data handling) with probability.
Since such spinners are easy to make, students can make their own and have fun finding empirical probabilities given theoretical ones (through the spinner). In fact, the Law of Large Numbers for probabilities, i.e., ‘the empirical probability converges to the theoretical one as the number of trials grow larger and larger (or goes to infinity)’, can be experienced with a spinner!
For this endeavour, online spinners like http://www.shodor.org/interactivateJS/AdjustableSpinner/AdjustableSpinner.html can be of great help. This online version allows one to generate a desirable circle very quickly by providing the number of sectors and the percentage for each sector (percentages must add up to 100).
It also allows one to spin it multiple times much faster. In fact, one can specify number of spins and it automatically generates the empirical (or experimental) probabilities as percentages.
One can try multiple sets of say 1 spin, 5 spins, 20 spins, 100 spins, 500 spins, 2000 spins, etc. [It is important to hit ‘update’ to avoid cumulative spins.] Table 1 includes the empirical probabilities from 4 sets of each (1 spin, 5 spins, 20 spins, etc.) for blue with theoretical probability 0.2 (Figure 3), i.e., the empirical probabilities for 100 spins are 0.23, 0.21, 0.21 and 0.26 from the 4 sets.
Now, check the spread (we have used standard deviation) for the empirical probabilities across each row. Observe how the spread is reducing as the number of spins is increasing.

Figure 3
Note how this also utilises spread or measure of dispersion to understand probability – another interlinkage with statistics.
Table 1
| No. of spins | Set 1 | Set 2 | Set 3 | Set 4 | Spread |
|---|---|---|---|---|---|
| 1 | 0 | 0 | 0 | 0 | 0 |
| 5 | 0.2 | 0.2 | 0.4 | 0 | 0.163299 |
| 20 | 0.1 | 0.2 | 0.35 | 0.1 | 0.118145 |
| 100 | 0.23 | 0.21 | 0.21 | 0.26 | 0.023629 |
| 500 | 0.192 | 0.2 | 0.166 | 0.188 | 0.014549 |
| 2000 | 0.204 | 0.204 | 0.201 | 0.198 | 0.002872 |
However, the NCTM version (https://www.nctm.org/adjustablespinner/) allows only equal sectors and therefore, only equally likely outcomes. So, it has a very limited scope.
While online spinners can generate the data much faster and therefore is great for demonstrations or workshops where time may be limited, one does not know how they actually work. So, the actual spinner can provide a more grounded experience where each spin is observed and recorded. So, it would be more suitable for younger children giving them a more direct experience.
We would like to end this review by considering spinners of different shapes. In which of the following spinners in Figure 4 would the two colours have equal probability? Why? Note how this brings the focus from the area to the angle at the centre, where the diagonals intersect (which is where the push pin should be stuck) and thereby interlinking geometry with probability. This also opens the discussion on why area sufficed for circular spinners.

Figure 4
About Math Space:
MATH SPACE is a Mathematics laboratory at Azim Premji University that caters to schools, teachers, parents, children, NGOs working in school education, and teacher educators. It explores various teaching-learning materials for Mathematics [mat(h)erials] both in terms of uses and regarding possibility of low-cost versions that can be made from boxes etc.
It tries to address both fear and dislike for mathematics as well as provide food for thought to those who like or love the subject. It is a space where ideas generate and evolve thanks to interactions with many people.
Math Space may be reached at mathspace@apu.edu.in
Acknowledgement: We would like to sincerely thank Angela Jain, MA Education student of Azim Premji University, for exposing us to the world of spinners. She explored this as part of her project in the Curricular Material Development – Mathematics course. Most of the figures are thanks to her.