Mathematics training for teachers on explaining fractions to students
Arddhendu Shekhar Dash in At Right Angles (AtRiA) magazine helps identify possible misconceptions among students in their understanding of fractions. He analyses the reason for these and suggests ways to teach for a better conceptual understanding of fractions.
Fractions have long been earmarked as a danger zone for both students and teachers – while one needs to tread carefully here, the topic should not be shied away fromor treated with so much caution that students tend to handle it with reservation.
Misconceptions are a natural stage of conceptual development and should not be viewed as an undesirable occurrence. What is important is that the teacher is aware of them and addresses them to the extent possible.
A word of caution: there is always scope for a student to over generalise or misapply a rule. A teacher may not be able to prevent all such misconceptions as they can be hidden from view. The focus needs to be on exposing children to carefully chosen examples.
What is of value is helping children to explain their thinking and discussing their thinking with their peers and teachers, which in turn leads to a growth in understanding.
In the concept of fraction, there are some misconnects observed like — each part of the whole must be congruent, the shapes should be symmetrical in case of halves, the objects in the set model must be of equal shape and size.
These misconceptions can be avoided if students are allowed to explore concepts through the use of objects/shapes, use of various models in classroom teaching, use of various types of examples other than examples of the textbook, connecting the concepts with real-life situations and building discussion among the students in the process of teaching.
The focus of this article is on identifying possible misconceptions that students can have in their understanding of fractions, analysing the reason for such misconceptions and suggesting ways to plan teaching for a better conceptual understanding of fractions.
The process of identifying misconceptions is based on the analysis of data from the work of the Azim Premji Foundation with teachers and students of class V.
Most of our primary school curriculum uses the examples, illustrations, and activities related to the ‘Area Model’ and ‘Set Model’ in teaching fraction (details of which are given in the latter part of the article).
I had prepared a worksheet with some direct questions based on the textbook content and some higher order thinking questions. I shared these with the students and then discussed their responses with them as well as their teachers.
In this article, I am highlighting the responses to some questions. I hope this will help teachers to know more about how children understand this topic and to revisit and, perhaps, bring to surface and address gaps in their classroom practice.
Area Model
Students were shown representations of different fractions using this model and asked if the fraction matched with the representation. The responses of children to the questions and discussion on these questions could be divided into four cases.
Case 1 (Symmetry):
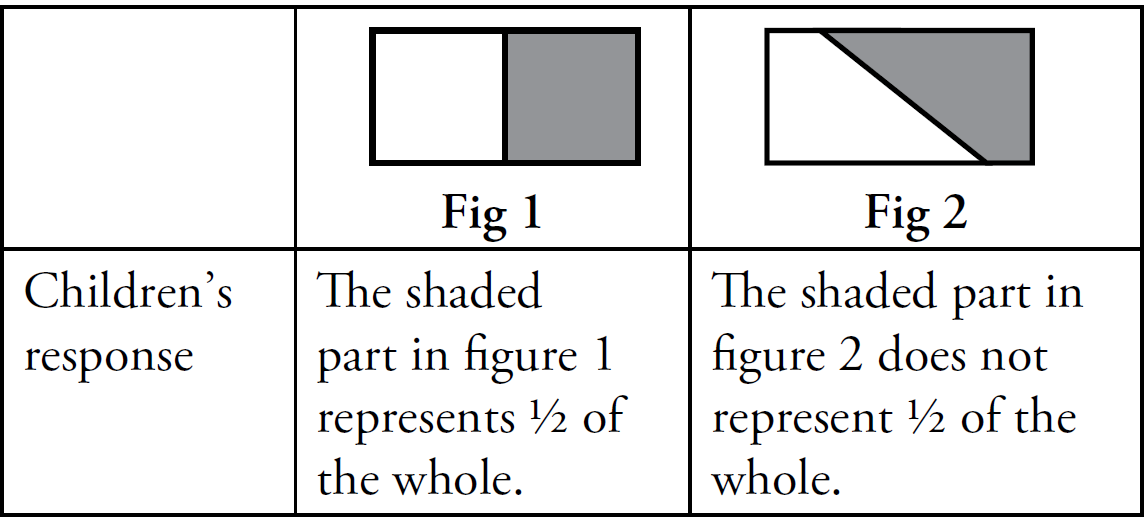
During the interaction regarding Fig 2, the children were asked to cut the figure into two parts along the line and place one part on top of the other. The students then said that both parts have the same area but if we fold along the line then both parts will not coincide completely on each other, unlike in the case of Fig 1.
It was clear that students understood the importance of equal area of each part but, along the way, had developed the notion that the shape must be symmetrical along the line of division of the shape. This symmetry issue is only limited to the representation of ½.
During my interaction with teachers regarding this, it was observed that the figures used to teach the concept of ½ using the area model usually had a straight line segment dividing the whole into two equal parts horizontally or vertically (see Fig 3).
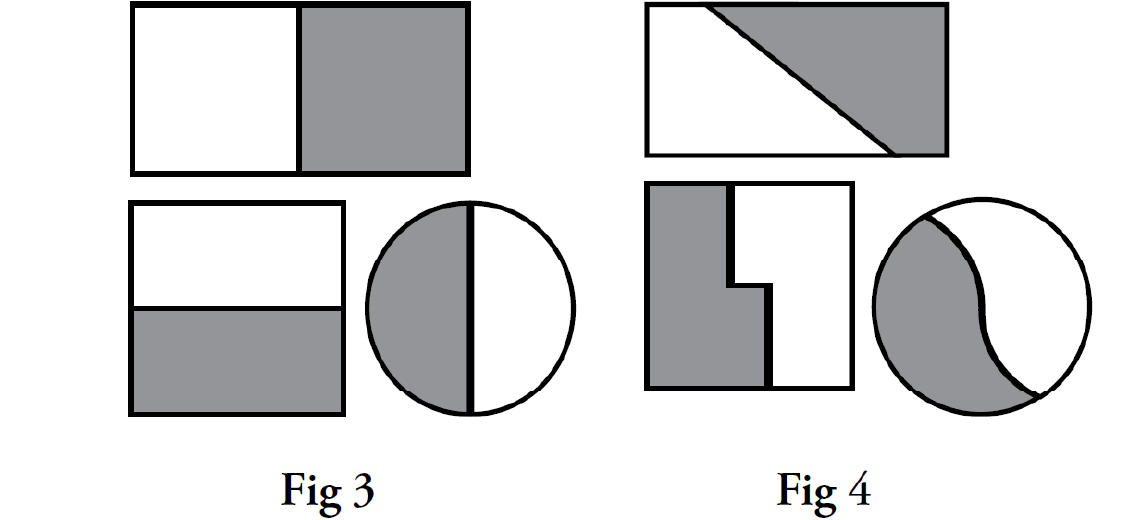
Figures in which a shape could be divided into half using slanting or curved lines as shown in Fig 4 were hardly ever used.
Another observation was that the state textbook has not focused on providing the opportunity for students to divide a shape into some given number of equal parts in different ways.
They only allow children to identify the correct divisions in the given figure. Also, the paper folding activity in teaching equal division or teaching fractions could lead to such misconception, as usually, in paper folding, we use the concept of line symmetry.
Note: The students are exposed to both line symmetry and rotational symmetry in class 5.
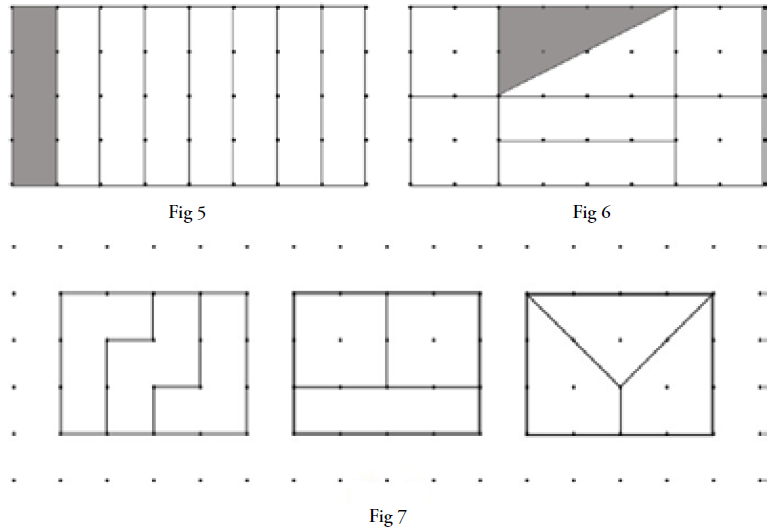
Case 2 (Congruent Shape): While students agreed that the shaded part in Fig 5 represented 1⁄8 of the whole, they felt that the shaded part in Fig 6 did not. When taken through the step by step process of dividing the shape of Fig 6 into equal parts they agreed that all parts have equal area but the shape of each part is different.
It became apparent that they had developed the notion that each part of the whole would be of the same size and the same shape.
While interacting with teachers regarding this, it became clear that some of them also felt the same. Unfortunately, those who agreed that Fig 6 also showed 1⁄8 had neither used such examples in their classroom teaching nor come across them in the textbook.
One of the best ways to deal with such issues is by using a square dot sheet for dividing a shape into an equal number of parts in different ways.
In Fig 7, a rectangular shape is divided into three equal parts in different ways. We can provide such square dot sheets and ask students to explore different ways of dividing a shape into equal parts.
This square dot sheet helps in visualizing the dimension of each part without any measuring instrument and also in finding the area of each part by just counting the square blocks or parts of square blocks.
Case 3: When the figure representing the whole is not completely divided into equal parts, children get confused.
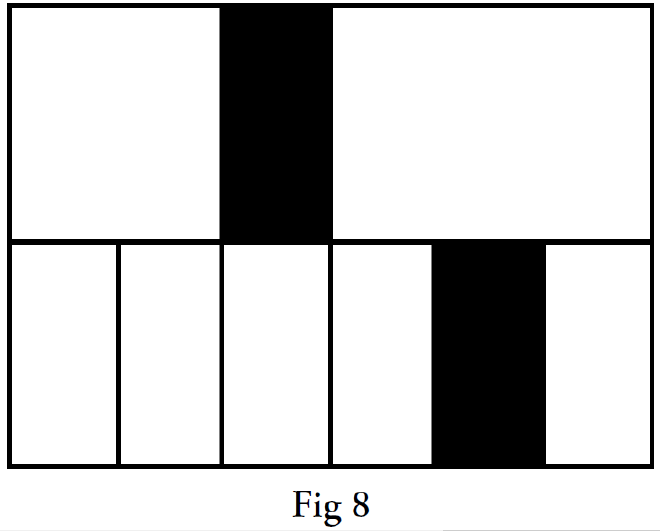
In Fig 8, most of the students, when asked for the fraction representing the shaded portion, gave the answer 2⁄9.
They directly counted the total number of parts as 9 with 2 of the 9 parts shaded. They knew that equal division is important in fraction. However, applying the concept of equal division in such cases was challenging for students.
We observed that they did not find it easy to divide the whole into equal parts, even though the lower half of the whole was divided into six equal parts.
When we interacted with the teachers, we pointed out that their textbook had a few simple examples of such type but that they needed to practise such types of questions in the classroom.
We recommended that they highlight that in all cases, before writing the fraction, students should first do a check if the whole had been divided into equal parts.
Case 4: At first sight, students did not agree that the shaded part in the given Fig 9 represented 4⁄6 of the whole. Their response was that it is 2⁄3.

Fig 9

Fig 10
When, as shown in Fig 10, we divided each triangle further into two equal parts, they could now see the shaded part as 4⁄6 of the whole. But some of them were a little confused with the two values of the same representation as they faced difficulty in connecting the concept of equivalent fractions in this problem.
The reason could be lack of exposure in the visualization of equivalent fractions in their regular classroom teaching and such types of problems could have been omitted from their practice.
Set Model
Again, students were shown representations of different fractions using this model and asked if the fraction matched with the representation. The responses of children to the questions and discussion on these questions could again be divided into four cases.
Case 1 (Scaling or Equivalent Fraction): Students do not agree that the encircled part represents 2⁄7 of the set; their answer was 4⁄14 (refer Fig 11), as the number of objects in the set is 14 and the objects encircled is 4.
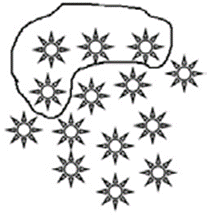
Fig 11
They faced difficulty in connecting the concept of equivalent fractions and the teachers also agreed that they hardly ever used the set model to teach equivalent fractions.
One way of addressing such types of questions is by asking the children how we can make the 14 objects in the set to be 7? One way could be by pairing objects in the set. (See Fig 12.) The total number of pairs is 7 and the number of pairs in the encircled part of the objects is 2.
Now students can understand that the fraction of the encircled pair of objects is 2⁄7 of the pairs of objects in the set.
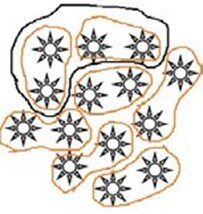
Fig 12
Case 2 (Size of objects in the set): Students do not agree that the encircled part of the marbles is 1⁄3 of the set of marbles (Fig 13). The reason was that the marbles in the set were of different sizes.
They relate this question with the area model, where the whole is divided into parts of equal size. During the discussion, we used the example – suppose half of the students in your class are absent (the total number of students in that class was 24), then their response was 12 students were absent.
When asked how they knew this, they replied that there are 24 students in the class and half of the students of the class are absent, so 24⁄2 is 12. Then my question was whether all the children in their class were of equal height, weight, colour. Their answer was that all students are not of the same height, weight and colour.
Then we discussed that in representing part of some objects from a collection, it is not necessary that all the objects in the set/collection be of the same shape, size, colour.
Only the number of objects is important in this case.
Another way could be to place 3 marbles (we can take more than 3) of different sizes as in Fig 13 and ask children how many marbles are there in the collection. Ask them to separate 1⁄3 of the marbles, then observe the response of students and if they could separate one marble, then discuss why they separated one marble and discuss the importance of number (not size) in this case.
If they are confused with the size, then discuss the real-life situation as discussed above, of the absence of students in their classroom.
During the interaction with teachers, it was clear that they shared the same doubt regarding the size of the objects in the set. In the textbook, all the problems had sets of objects of the same shape and size.
It is important to understand the characteristics of both the models and the suggested process to plan the use of these models in classroom teaching.
Characteristics of the Area Model and Set Model
Area Model: This is the simplest model of fractions and is widely used in textbooks and classroom teaching. As compared to the line model or volume model, the area model requires a two-dimensional plane to explore and most of the objects available with us such as the surface of the textbook, board, page of notebook, etc., are two dimensional and also easy to operate on.
In this model of fraction, the whole is determined by the area of a defined region. Each part of the whole should be of the same area, but not necessarily the same shape. In this model, the fraction indicates the covered part of the whole unit of area.
For example, as in Fig 5 and Fig 6 we can find that the whole is the area covered by a rectangular shape and the whole is divided into eight equal parts. Here equal parts mean the area of each part is the same.
But, if we compare both the figures, we see that in the former, each part has the same shape whereas in the latter they are not all of the same. The shaded part in both the figures represents 1⁄8 of the whole unit.
While planning to teach, in the initial discussion, we should divide the whole into parts of equal area with the same shape and then we will work with students having figures with the same area and different shapes. As we know, before teaching fraction, we should allow students to explore different ways of dividing a shape into some number of equal parts.
In this area model of teaching fraction, we should use figures, grid papers, paper folding activity, tangrams, etc. In Fig 14, 3⁄4 is represented by using a square, grid paper, and tangram.
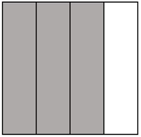
Fig 14- Shared part
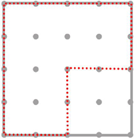
Fig 14- The area enclosed by red dots
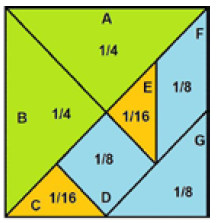
Fig 14- Area of (A+B+F+G)
Set Model: This is the model of fraction, in which a set is defined as a collection of well- defined objects, and a part is defined as a certain number of these objects, and the fraction indicates the number of objects in the subset of the defined set of objects.
For example, as in Fig 15, the set is the collection of six fruits, and the enclosed fruits are 2⁄6 or 1⁄3 of the set.
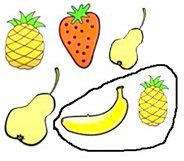
Fig 15
Here we are considering the number of fruits only, not the size or color or shape of the objects.
In this model of fraction, the objects in the set can be arranged in an array (as in Fig 16) or arranged randomly (as in Fig 17).
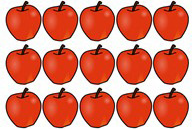
Fig 16
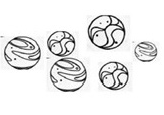
Fig 17
Teaching Approach: Based on the above misconceptions observed among students we can plan our teaching as below –
- Before teaching fraction, we should work on equal divisions. With identifying the equal division in shapes, we should also ask students to divide the shapes into some number of equal parts in different ways.
- Use different types of examples: In teaching both the models use a variety of examples so that students can get exposure and develop the correct concepts. For example, to introduce fraction using the set model we can use different examples of sets having objects of a homogeneous group, different examples of sets having objects of a heterogeneous group and real-life examples: the fraction of children of class 5 dressed in red, etc. This will help students in developing the concepts correctly.
- Always initiate the discussion from simple examples and concepts based on the level of students. For example, we can start with the area model before set models. In the area model, we can start with parts having the same shape and then of different shapes.
- We can use shapes, dot sheet papers, paper folding activities, tangram activities and real- life examples in teaching fraction.
Mindful planning will yield rich results and it is hoped that this article will help you do just that.
About the author:
Arddhendu Shekhar Dash is a Resource Person at Azim Premji Foundation. He has MSc in mathematics from Utkal University, Vani Vihar, Bhubaneswar. He has been closely working with teachers on issues related to Mathematics and conducts workshops focusing on the conceptual as well as pedagogical strategies used in teaching mathematics.
He has been doing mathematics with children for more than 8 years and is deeply interested in exploring and designing tech resources. He is also engaged in the process of designing curriculum for Open Distance Learning and writing textbooks for Chhattisgarh.
He may be contacted at arddhendu@azimpremjifoundation.org.