A Tale of Two Demographies: Employment Outcomes and Gender Differentials in India, 2017 – 18 to 2018 – 19
Introduction
The recently released Periodic Labour Force Survey (PLFS) 2018 – 19 data covering the time period between July 2018 and June 2019 presents a landscape that has considerably altered with the onset of the COVID19 pandemic. Analyzing the same is still useful however, given that it provides us a snapshot of what the labour market looked like just before the pandemic struck and allows us to anticipate the pandemic’s differential impact on the working population.
The controversy between the comparability of PLFS and the erstwhile Employment Unemployment Surveys (EUS) surveys notwithstanding (Kant, 2019; Mohanan and Kar, 2019), while the 2017 – 18 PLFS recorded an unemployment rate (UR) of 6.1 percent, the highest the Indian economy had faced in the last 45 years, the 2018 – 19 survey records a relative reduction in unemployment, 5.8 percent in 2018 – 19 (Table 1). Between 2018 – 19 and 2017 – 18, unemployment rates have fallen for all categories save for urban males for whom it has remained unchanged (Table 1). As has already been noted, there has been an increase in both the labour force participation rates (LFPR) and worker participation ratio (WPR) for all employment categories except that of urban males. [1] A significant change is seen with respect to rural females, whose WPR has risen by 1.5 percentage points during the past one year. This is interesting given that the trend since 2004-05 onwards has been that of a fall in the WPR across all demographic categories. (Nath et al. 2019)
The reduction in unemployment and rising work force participation of women, however, must be approached with caution. As shall be outlined in this note, there is a divergence of outcomes for men and women. While men see an increase in regular employment in urban areas, women experience an expansion of self-employment with falling real incomes, especially rural women hailing from the poorest households.
Table 1 LFPR, WPR and UR (in percent) measured according to Usual status, 2017 – 18 &2018 – 19
| 2018 – 19 | 2017 – 18 | |||||
|---|---|---|---|---|---|---|
| LFPR | WPR | UR | LFPR | WPR | UR | |
| Rural Males | 55.1 | 52.1 | 5.6 | 54.9 | 51.7 | 5.8 |
| Rural Females | 19.7 | 19.0 | 3.5 | 18.2 | 17.5 | 3.8 |
| Urban Males | 56.7 | 52.7 | 7.1 | 57.0 | 53.0 | 7.1 |
| Urban Females | 16.1 | 14.5 | 9.9 | 15.9 | 14.2 | 10.8 |
Source: Unit level data, PLFS 17 – 18 and PLFS 18 – 19
Employment generation but with differential outcomes
We apply the WPR ratios obtained from the PLFS surveys on the population figures provided by the government to arrive at broad estimates of total employment generated.[2] [3] We find that during the aforementioned period the workforce grew by a little more than 13 million persons (Table 2), an increase in the workforce that is roughly equal to the number of jobs lost between 2011-12 and 2017 – 18. [4] [5]
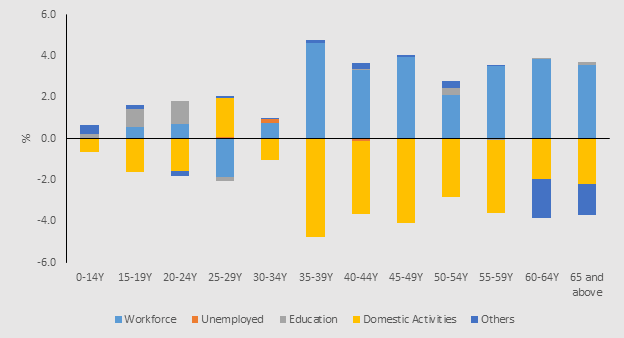
These increases are largely seen in the categories of urban men and rural women. 6.9 million rural women and 5.3 million urban men joined the workforce during this period. The rise of the former is interesting, given that the story of the employment loss witnessed between 2011-12 to 2017 – 18 was one of rural women leaving the workforce (Kannan and Raveendran, 2019). From figure 1, we note that the rise in rural female workforce numbers has been down to women moving away from domestic activities and entering the workforce as active participants. This phenomenon has taken place across age groups, save for the 25 – 29 year age group where the reverse is observed.
Table 2. Absolute change in employment between 2017 – 18 to 2018 – 19 (in millions)
| Rural | Urban | Rural + Urban | |||||||
|---|---|---|---|---|---|---|---|---|---|
| Male | Female | Total | Male | Female | Total | Male | Female | Total | |
| OAW | -0.08 | 3.57 | 3.49 | 0.29 | 0.64 | 0.93 | 0.21 | 4.21 | 4.41 |
| Owners | 0.25 | 0.09 | 0.34 | 1.15 | 0.11 | 1.26 | 1.40 | 0.20 | 1.60 |
| Unpaid | -1.62 | 1.96 | 0.34 | 0.05 | -0.21 | -0.16 | -1.57 | 1.75 | 0.18 |
| Regular | 0.57 | 1.15 | 1.72 | 4.03 | 1.63 | 5.66 | 4.60 | 2.78 | 7.38 |
| Casual | 0.03 | 0.10 | 0.13 | -0.21 | -0.45 | -0.66 | -0.17 | -0.35 | -0.53 |
| Total | -0.85 | 6.87 | 6.02 | 5.31 | 1.71 | 7.02 | 4.47 | 8.58 | 13.04 |
Source: Unit level data, PLFS 17 – 18 and PLFS 18 – 19; Note: OAW- Own Account Workers
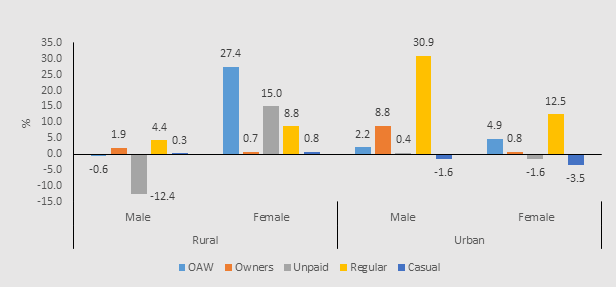
A majority of this employment rise is due to an increase in the number of urban men engaged in regular salaried work (31%) followed by female own account workers (OAWs) based in the rural sector (27%) (Figure 2). Unpaid females (rural) and regular salaried females (urban) have also contributed to the overall employment gain. In absolute terms, 4.03 million jobs were created for urban regular salaried men between 2017 – 18 and 2018 – 19 (Table 2) while there was a corresponding rise of 3.57 million rural female OAWs. 1.96 million unpaid female helpers also entered the rural workforce during this time, while roughly the same number of unpaid males had left the rural labour market during this time
Thus the first pattern that emerges is a divergence in employment outcomes for urban men and rural women. The urban men find themselves accessing regular employment, which, on average, has higher wages and better conditions of work relative to other employment categories. Rural women, however, find themselves working in self-employment, with a significant share working as unpaid family labour.
Figure 1. Change in share of activity status between 2017 – 18 and 2018 – 19 by age groups, Rural Females (UPSS) [6]
Source: Unit level data, PLFS 17 – 18 and PLFS 18 – 19
Figure 2. Contribution to Employment Gain (in %) by Activity status (UPSS)
Source: Unit level data, PLFS 17 – 18 and PLFS 18 – 19
Patterns of employment growth
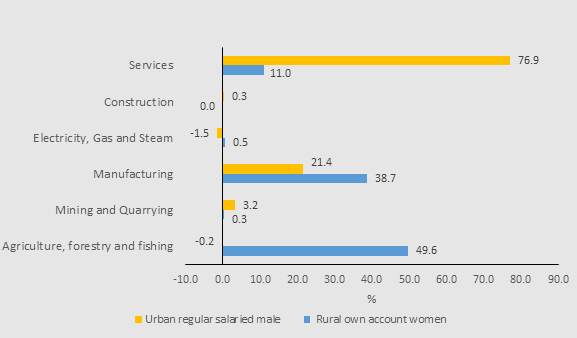
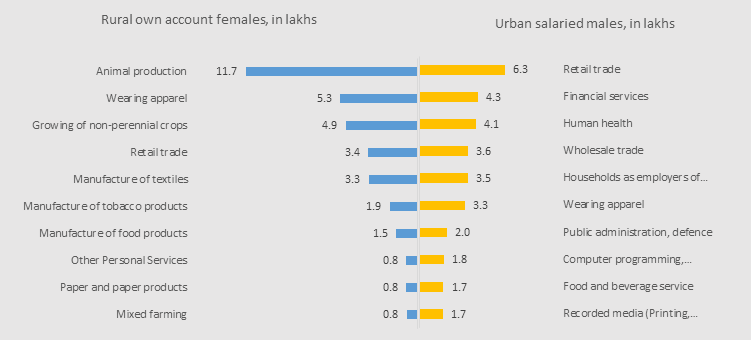
The employment gain narrative of regular salaried men in urban areas is primarily a service sector driven story with 77 percent of the 4 million odd jobs created having taken place here (Figure 3). The major avenue of this employment generation has been in retail trade (6.3 lakh new jobs) followed by financial (4.3 lakhs) and health services (4.1 lakhs) (Figure 4).
Rural OAWs constituted more than half of all female employment created in the rural labour market. Much of this 3.6 million rise in female OAWs (rural) was driven by employment creation taking place in the agricultural sector followed by jobs created in manufacturing activities. (Figure 3) In the rural labour market, 11.7 lakh women entered into animal production, around 5.3 lakh women started working as self-employed workers in textile production while another 4.9 lakh engaged themselves in non-perennial crop production.
Figure 3. Contribution to employment increase (%) by industrial group, 2017 – 18 to 2018 – 19
Source: Unit level data, PLFS 17 – 18 and PLFS 18 – 19
Figure 4. NIC 2⁄3 digit industries where employment grew the most between 2017 – 18 and 2018 – 19 (in Lakhs)
Source: Unit level data, PLFS 17 – 18 and PLFS 18 – 19
Falling earnings of female OAWs
Though there was an increase in regular wage employment for urban men, they did not enjoy significant wage gains; their real wage earnings grew by around 2 percent for the year. (Table 3b) The biggest income growth for men was seen for OAWs in the urban areas. The situation for female OAWs, on the other hand, is worrying. Their earnings decreased over this period, for both rural and urban areas. The biggest gains were seen for female employers, though only a miniscule fraction of the rural female workforce finds employment here. The real earnings of rural female OAWs in agriculture witnessed a very significant decline of almost 4.5 percent (Table 4) Given that much of the increase in female self-employment is seen in rural agricultural OAWs, a large section of the rural female workforce was thus affected by falling real incomes. Secondly, even though secondary sector real incomes were rising, the level of these incomes was extremely low.
An argument could be made to say that even though real incomes are falling, it would imply an improvement in welfare for those women who were earlier engaged in domestic work but are now in paid work. This may be true, but we would disagree that such a situation implies an unambiguous increase in welfare. While first-time workers may see an increase in incomes, real incomes would fall for those women who have always been working in these sectors, indicating that they would have to work longer and harder to maintain a given standard of living. Falling average real incomes, while representing a rise in aggregate income for first-time workers, might indicate the prevalence of “distress employment”, where workers engage in poorly paid activities in order to supplement falling levels of household consumption. Such a situation was seen during the period 1999 – 2000 to 2004-05, where employment growth rose significantly in the presence of widespread agrarian distress. As Abraham (2009) wrote, this could signal a situation where the non-working population enters the labour market to ameliorate a situation of profound economic insecurity. Whatever be the factors leading to increased labour market participation of rural women, the fact that the average levels of real incomes have been falling does not bode well for an economy and its workforce.
Table 3a: Average Monthly Real Incomes by Employment Categories (in Rs), 2017 – 18 to 2018 – 19 [7]
| Male | Female | |||||||
|---|---|---|---|---|---|---|---|---|
| 2017 – 18 | 2018 – 19 | 2017 – 18 | 2018 – 19 | |||||
| Rural | Urban | Rural | Urban | Rural | Urban | Rural | Urban | |
| Casual Worker | 4302 | 5261 | 4455 | 5508 | 2600 | 3128 | 2685 | 3323 |
| Employer (HH Enterprise) | 10858 | 21479 | 11044 | 22247 | 5603 | 13729 | 6994 | 18884 |
| Own Account Worker | 6325 | 10953 | 6520 | 12006 | 2945 | 4614 | 2944 | 4543 |
| Regularly Employed | 9760 | 13712 | 9545 | 13970 | 6448 | 10885 | 6164 | 11251 |
Source: Unit level data, PLFS 17 – 18 and PLFS 18 – 19
Table 3b: Change in monthly real incomes, 2017 – 18 and 2018 – 19
| Male | Female | |||
|---|---|---|---|---|
| Rural | Urban | Rural | Urban | |
| Casual Wage Worker | 3.55% | 4.70% | 3.26% | 6.25% |
| Employer in Household Enterprise | 1.71% | 3.58% | 24.82% | 37.54% |
| Own Account Worker | 3.08% | 9.62% | -0.03% | -1.55% |
| Regular Salaried Worker | -2.20% | 1.88% | -4.40% | 3.37% |
Source: Unit level data, PLFS 17 – 18 and PLFS 18 – 19
Table 4: Real earnings growth of rural female workers by sector, 2017 – 18 and 2018 – 19
| Casual | Employer | OAW | Regular Employment | |
|---|---|---|---|---|
| Primary | 4.04% | 29.25% | -4.52% | -1.18% |
| Secondary | -1.33% | -37.96% | 14.38% | 9.03% |
| Tertiary | 19.65% | 70.64% | 13.50% | -6.31% |
Source: Unit level data, PLFS 17 – 18 and PLFS 18 – 19
Women entering the rural workforce as OAWs primarily from lower income households
Much of the increase in workforce participation by rural women has come from those hailing from lower income households. Higher-income households have seen an increase in women’s work – not of the same magnitude – while households in the middle of the income distribution have seen a reduction.[8]
Table 5 shows the contribution to the change in the overall labour force accounted for by different activity categories according to the UPSS. Nearly 35 percent of the increase in the overall rural female labour force is accounted for by women in the bottom 50 percent of household consumption working as OAWs. 30.6 percent is accounted for by women from the bottom 10 percent of households working as unpaid helpers alone. Women from the bottom 10 percent of households overwhelmingly increased the numbers of those working as casual labour.
21 percent of the increase in rural female OAWs came from women of the bottom 10% of household consumption entering the primary sector. In fact, 50 percent of the total increase in the rural female labour force came from women in the bottom 50 percent of households entering the primary sector. This is worrying because this is also a sector that has seen a fall in real incomes. By contrast, women from the top 50 percent accounted for almost 12 percent of the increase in the rural labour force, with a huge reduction in the number of women from the 50 percent to 75 percent category of household consumption.
Table 5: Contribution to change in rural female labour force, by employment status and household consumption categories [9]
| UPSS | Bottom 10% | 10% to 25% | 25% to 50% | 50% to 75% | 75% to 90% | Top 10% |
|---|---|---|---|---|---|---|
| Own Account Worker | 16.7% | -0.5% | 18.8% | -0.6% | 11.6% | 6.0% |
| Employer in HH Enterprise | 0.0% | 0.0% | 0.1% | -0.1% | 0.6% | 0.8% |
| Unpaid Helper | 30.6% | 4.9% | 9.6% | -28.1% | 8.7% | 2.7% |
| Regular wage worker | 5.1% | 1.8% | 2.9% | -4.8% | 10.0% | 1.8% |
| Casual Worker (public) | 4.6% | -0.9% | 1.8% | -1.0% | 6.1% | 1.4% |
| Casual Worker (private) | 24.9% | -10.2% | -6.6% | -21.9% | 3.0% | 0.3% |
| Unemployed | 0.7% | 0.1% | -0.3% | -1.5% | 0.1% | 1.1% |
Source: Unit level data, PLFS 17 – 18 and PLFS 18 – 19
Table 6: Contribution to change in rural female labour force, by sector and household consumption categories
| Bottom 10% | 10% to 25% | 25% to 50% | 50% to 75% | 75% to 90% | Top 10% |
|---|---|---|---|---|---|
| Primary | 21.18% | -1.78% | 18.47% | -8.40% | 11.74% |
| Secondary | 5.29% | -0.31% | 14.05% | 9.52% | 9.97% |
| Tertiary | 5.59% | 1.14% | 3.66% | -2.34% | 0.69% |
Source: Unit level data, PLFS 17 – 18 and PLFS 18 – 19
Conclusion
The 2018 – 19 PLFS reveals a worrying picture of polarisation in employment outcomes. Men find employment in urban regular wage jobs, while women largely find work in rural self-employment. This expansion of women’s employment is not an unambiguously positive development. A large share of it is in unpaid work and self-employment, with self-employment earnings falling over the period in real terms. Moreover, the primary sector sees an increase in female OAWs from poorer households, who experience the burden of falling real incomes.
The results of the PLFS provide a view on how deeply the current pandemic, lockdowns, and the reverse flow of migrant workers might severely change work and gender dynamics in the Indian economy. With a large number of male migrants leaving jobs in the cities and returning to rural areas, there is the possibility that rural women move back into domestic duties, as men take up agricultural jobs. Moreover, given that the expansion of employment in agriculture saw a reduction in real earnings even before the pandemic, one can expect whatever rural employment to emerge from the pandemic to be of reduced real earnings. The rural economy requires a massive expansion of public works and fiscal assistance to tide over the deadly pandemic that is still running rampant in our economy.
NOTES
[2] Midpoint moments of the surveys centered on 1st of January, 2018 and the 1st of January, 2019 respectively.
[4] Workforce includes those who are employed while the labour force consists of those who are employed and unemployed. The labour force participation rate (LFPR) is defined as the percentage of persons in the labour force among the persons in the population. Worker Population Ratio (WPR) is the percentage of persons employed among the persons in the population.
[5] The period between 2011-12 and 2017 – 18 noted an absolute fall in employment to the tune of 9 (Mehrotra and Parida, 2019) to 16 million (Himanshu, 2019).
[6] Each vertical bar shows the change in share of activity statuses within each age bin between the time period 2017 – 18 and 2018 – 19.
[7] Real values were derived by deflating nominal values – wages for casual and regularly employed workers and self-reported earnings for the self — employed – by the CPI-2012 values for rural and urban sectors.
[8] As found in Klasen et al (2019), rising education and income levels exert a negative effect on women’s workforce participation levels in poorer economies. Research has also found a U‑shaped pattern with regard to education and female labour force participation, with participation high for women with low and high levels of education, and low for those in the middle of the distribution.
[9] Each cell shows the change for each employment status and household consumption category as a share of the change in the total labour force of rural women from 2017 – 18 to 2018 – 19.
[10] Each cell shows the change in each sector and household consumption category as a share of the change in the total labour force of rural women from 2017 – 18 to 2018 – 19.
References
Abraham, V. (2009). Employment Growth in Rural India: Distress-Driven? Economic and Political Weekly, 44(16),
Himanshu. (2019, August 1). Opinion: The seriousness of the problem of unemployment in India. Retrieved from https://www.livemint.com/opinion/columns/opinion-the-seriousness-of-the-problem-of-unemployment-in-india-1564679281965.html
Kannan, K. P., and Raveendran, G. (2019). From Jobless to Job-loss Growth Gainers and Losers during 2012 – 18. Economic and Political Weekly, 54(44), 38 – 44.
Kant, A. (2019, February 05). India’s employment: The true picture. Retrieved August 15th, 2020, from https://www.business-standard.com/article/opinion/india-s-employment-the-true-picture-119020501601_1.html
Klasen, S.; Pieters, J.; Santos Silva, M. and Le Thi Ngoc Tu (2018). What drives female labor force participation? Comparable micro-level evidence from eight developing and emerging economies, Discussion Papers, No. 253, Georg-August Universität Göttingen, Courant Research Centre – Poverty, Equity and Growth (CRC-PEG), Göttingen
Mehrotra, S., and Parida, J. K. (2019). India’s Employment Crisis: Rising Education Levels and Falling Non-agricultural Job Growth. CSE Working Paper, 2019(04), 1 – 22. Retrieved from https://cse.azimpremjiuniversity.edu.in/wp-content/uploads/2019/10/Mehrotra_Parida_India_Employment_Crisis.pdf
Mohanan, P. C., & Kar, A. (2019, February 12). NSSO jobs data discredited as it challenges carefully cultivated narratives. Retrieved August 15th, 2020 from https://www.business-standard.com/article/opinion/data-in-a-narrative-driven-debate-119021201209_1.html
Nath, P., Siddiqi, U and Sood, A. (2019) Thinking Growth or Thinking Employment. India Exclusion Report 2018 – 19. (5th ed.). (New Delhi: Yoda Press)
____________________________________________________________________________________________
Suggested citation: Nath, Paaritosh and Rahul Menon. 2020. “A Tale of Two Demographies: Employment Outcomes and Gender Differentials in India, 2017 – 18 to 2018−19”. Centre for Sustainable Employment Blogpost December 2020, Azim Premji University, Bangalore.
Attributions
Centre for Sustainable Employment
Generating and supporting research in the areas of job creation, employment, and sustainable livelihoods.