Dig, Build, Learn: How we Built an Augmented Reality Sandbox
The sandbox, built by Bipin C, became one of the biggest hits at the Mountains of Life festival
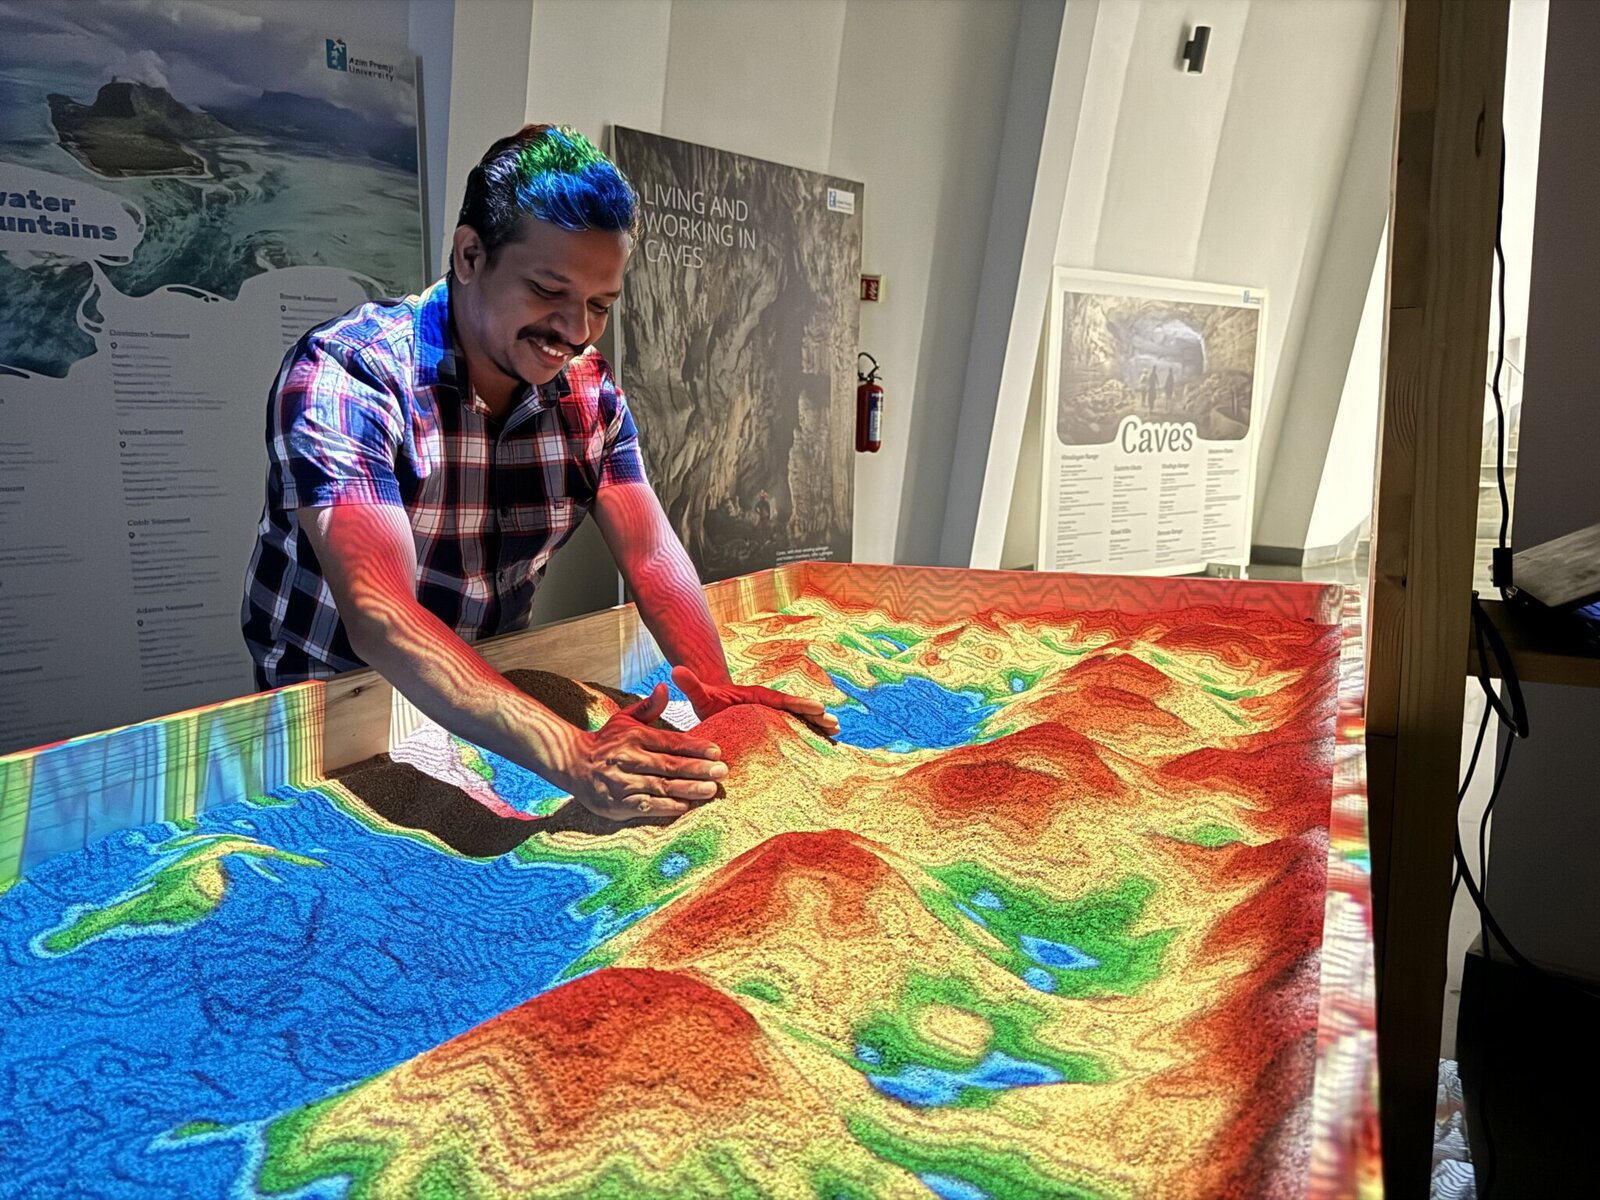
[Image Credit: Nandita Jayaraj]
All it took was nine days in February 2000, for us Earthlings to have the first ever high-resolution map of the surface of our planet. This was accomplished by engineers who were part of the Shuttle Radar Topography Mission (SRTM), and NASA astronauts aboard the Space Shuttle Endeavour. The SRTM employed a technology called radar. Radar antennae on Endeavour emitted radio waves towards Earth, and calculated the elevation based on the time it took for the waves to bounce back after hitting the surface. “When we look at the terrain on Google Maps today, the SRTM data is what we see,” says Bipin C, a researcher at the Azim Premji University who specialises in remote sensing.
Recently, Bipin was presented with a somewhat strange challenge: Could he use an SRTM-like strategy to build a sandbox for school students to play with? Naturally, this wouldn’t be any regular sandbox. It would change colour and contour lines based on the shapes and structures one makes on the sand. In other words, could he build an augmented reality (AR) sandbox?
As it turned out, Bipin could. And it ended up as one of the biggest hits at the Mountains of Life festival which took place in November 2024. Tens of thousands of school students visited the university over the two-week duration of the festival. It was rare to find a time when the two AR sandboxes were unoccupied. According to one of the organisers of Mountains of Life, “the kids went crazy, older people went crazy, our students went crazy… the best part was that the messaging was going across. They were learning.”
So what can you learn from a sandbox?
“It’s all related to land relief ( variations in the elevation and slope of the Earth’s surface), a term we probably heard about in geography,” said Bipin, as he demonstrated how the sandbox worked. With a few graceful sweeps of his hand, he sculpted a range of hillocks separated by depressions that instantly turned blue. “The blue signifies a water body, green is the vegetation, red and yellow indicates rocks and if we were using white sand, we could see white at the very top — snow.”
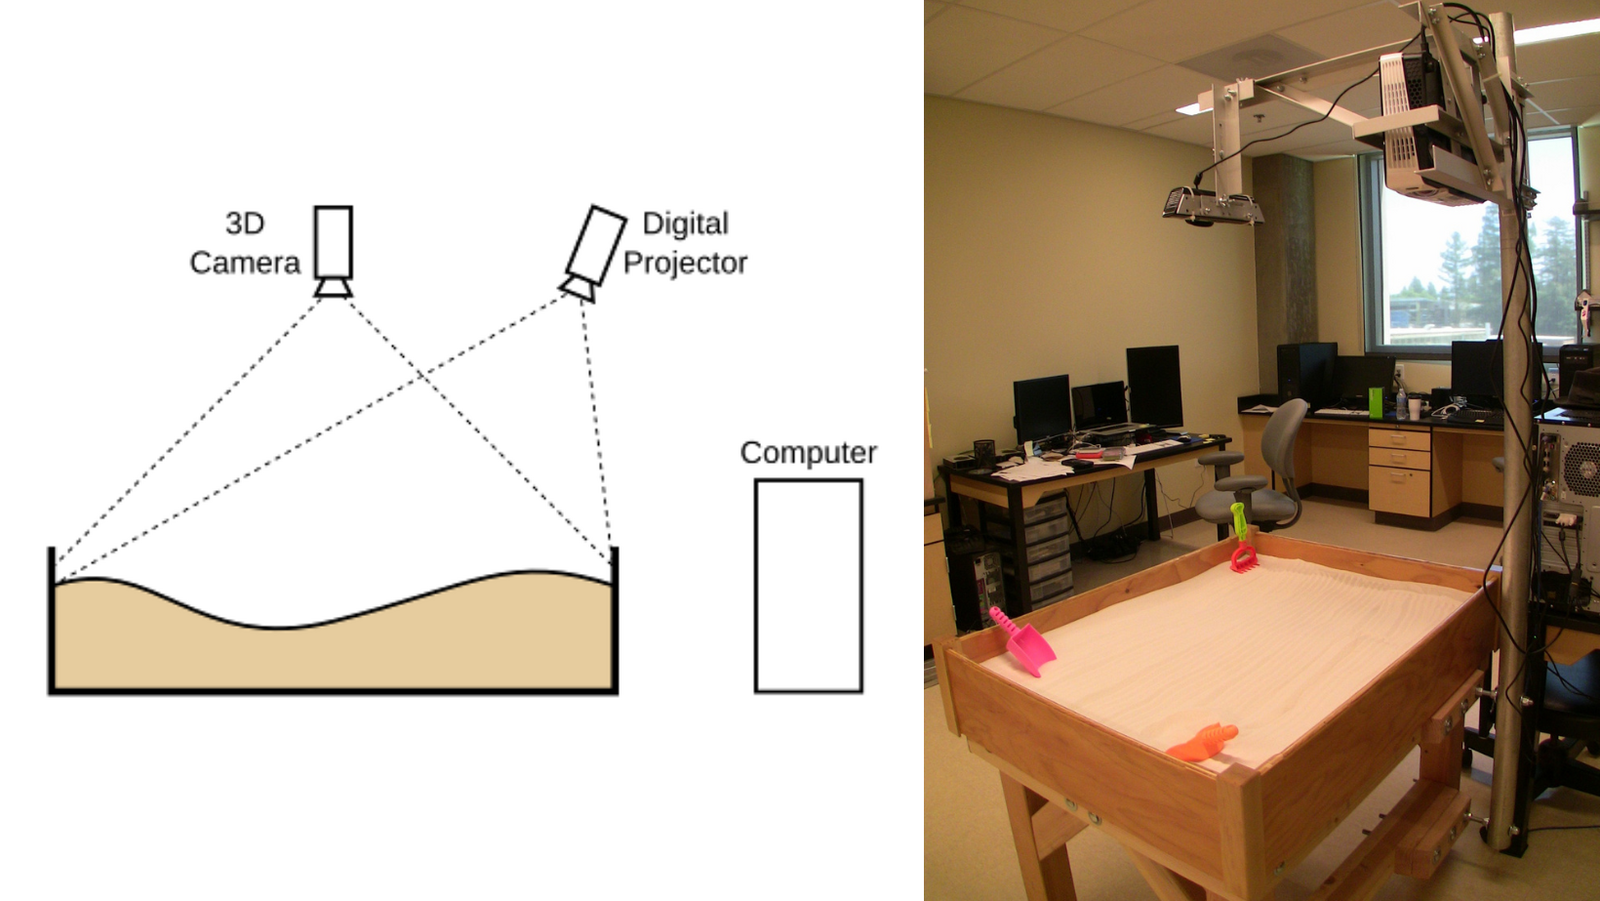
Simple diagram of the sandbox’s layout (left); A view of the entire sandbox assembly (right). Image Credit: Oliver Kreylos/University of California — Davis
Besides the mesmerising colours lighting up the otherwise dark corridor, the other noticeable aspect of the sandbox were the black wavy lines that got redrawn with every movement of the sand. “Those are contour lines. Equal heights connect a line, so if my mountain was a perfect cone, we would see concentric circles. Of course, in reality that would never happen,” Bipin added.
Not just sandcastles in the air
The playing with sand part may be what drew in the crowds, but the actual point of the AR sandbox is to enable the scientific representation of land relief with contour lines and colour coding. According to Bipin, the idea to try this on campus came from the ninth-grader son of a colleague after watching a video by popular American science teacher and Youtuber Craig Beals. Fortunately, Beals has made the technical information on how to build this available on his website, so Bipin knew that with some resourcefulness and adaptation, it was possible to recreate the exhibit on campus.
The star of the set-up would obviously be the sandbox itself, a rectangular pool of sand placed high enough for people to stand around and play. But the sandbox itself would be nothing special if not for a device mounted a few feet above it, a sensor. The sensor would work in a similar manner to the SRTM mission’s radar which mapped Earth 25 years ago. Except that in Bipin’s sandbox, the emitted radiation would be a laser, made from visible light waves which have shorter wavelengths than radar’s radio waves.
“This is called LIDAR (an acronym for Light Detection and Ranging) and it is a time-of-flight based instrument,” he explained. “That means that a pulse of radiation is sent down, gets reflected off a target and comes back. The time it takes to do this is measured and from this, the distance from the sensor to the target is calculated. So for a mountain, the distance will be shorter.”
The problem was, a LIDAR-based system would be too costly to purchase, and the point was for this exercise to be practical and reproducible in low-resource settings. Fortunately, Bipin could identify an affordable alternative. “The XBox 360 gaming console has LIDAR to detect the position of the players, so we could use their camera and adapt it for our use,” said Bipin.
“Inspiring children, it’s not a simple thing. We can’t do it just by showing graphs or data. They have to really feel it. And who knows, it may even trigger in them an interest towards GIS or remote sensing!”
Nuts and bolts of a sandbox
Near the LIDAR sensor is a projector which projects a contour map onto the surface of the sandbox. Essentially, the sandbox acts as the projector screen — one which can be manipulated by hand. These manipulations (shapes and structures) will determine the nature of the projected image. For example, the lowest points turn blue (as this is where water settles), with surrounding green (depicting vegetation), and the elevated areas tend to be drier, represented by yellows and reds. Participants can build whatever they like: rivers, islands, a mountain with a crater lake. With some modifications, they can also recreate volcanoes and rainfall.
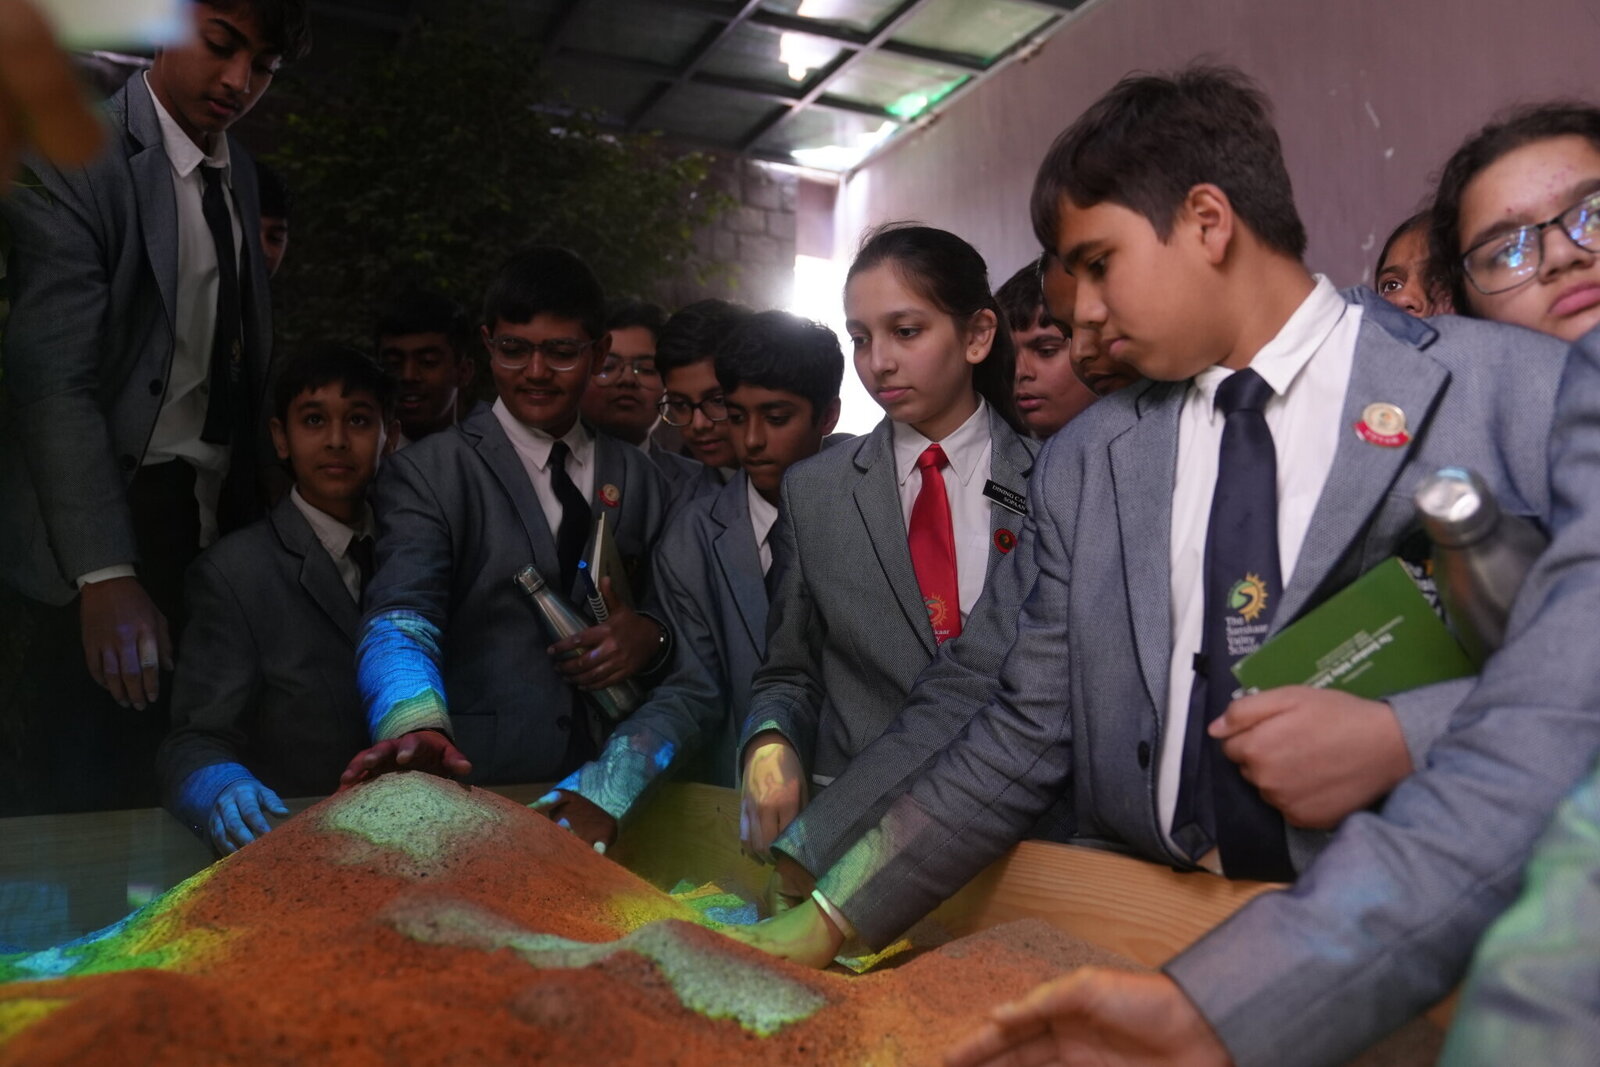
School students play with the sandbox during the Mountains of Life festival’s Bhopal edition in December. [Image Credit: Jayesh Nandane]
This interactivity is accomplished thanks to the software running on a laptop that is affixed to the set-up. The software used to create the AR sandbox was based on open-source code and utilities that were available online. However, in order to make it work, Bipin had to make several modifications. “The risk with open source softwares is that there is no one to give a 100 percent guarantee it will work,” he pointed out. “We had to test, experiment, and make sure the sensors interface correctly or are compatible with the software. This required a few rounds of compilation, error correction… we had to adapt.”
His journey was peppered with hurdles, but Bipin troubleshot his way out of each one. For example, the C++ software was from 2016 and it would only run on an Ubuntu operating system from that time. “Today’s laptop hardware would not support Ubuntu 16 drivers. We needed old hardware, so we went to IT and asked for their oldest laptops!” he laughed.
The testing phase was all done using a prototype — “a small sand tray” as described by Bipin. Only once they achieved a working prototype did they scale up into the two full-size models that are functional today. Carpenters were enlisted to fabricate the wooden structure for the various components, and Bipin’s colleagues helped with the procurement of hundreds of kilograms of sand. The final few days sped by at a frantic pace, with Bipin even having to stay overnight on campus a couple of times to tie up all the loose ends.
Not easy to inspire
Being a researcher with a passion for education, Bipin was deeply satisfied to witness students have fun with his AR sandbox. “For the first few minutes, they made various shapes in the sand – some were trying to make a peninsula, some modeled the Western Ghats… at a certain point they would start throwing sand at each other,” he laughed.
Now that Bipin and his team made the AR sandbox a reality, they have more ambitious plans. “We can simulate anything that happens on a terrain. For the upcoming Coasts and Oceans of Life, maybe we will model coastlines, cyclones and waves. Or maybe we can do a hydrodynamic simulation where we can model what will happen in case of a dam breach…”
For remote sensing experts, the principles behind the sandbox are extremely basic compared to the advanced atmospheric and earth science data modeling that they work with on a daily basis. But for Bipin, it’s still worth it. “Inspiring children, it’s not a simple thing. We can’t do it just by showing graphs or data. They have to really feel it. And who knows, it may even trigger in them an interest towards GIS or remote sensing!”
Links for further reading
- About NASA’s SRTM Mission: https://www.youtube.com/watch?v=byMqUgQ-PeU
- Differences between LIDAR and RADAR: https://flyguys.com/lidar-vs-radar/
- Technical information about the AR sandbox: https://web.cs.ucdavis.edu/~okreylos/ResDev/SARndbox/
Nandita Jayaraj is a Science writer and Communications Consultant at Azim Premji University.